📈 Trading Strategy Explanation (Support–Resistance + RSI Strategy)
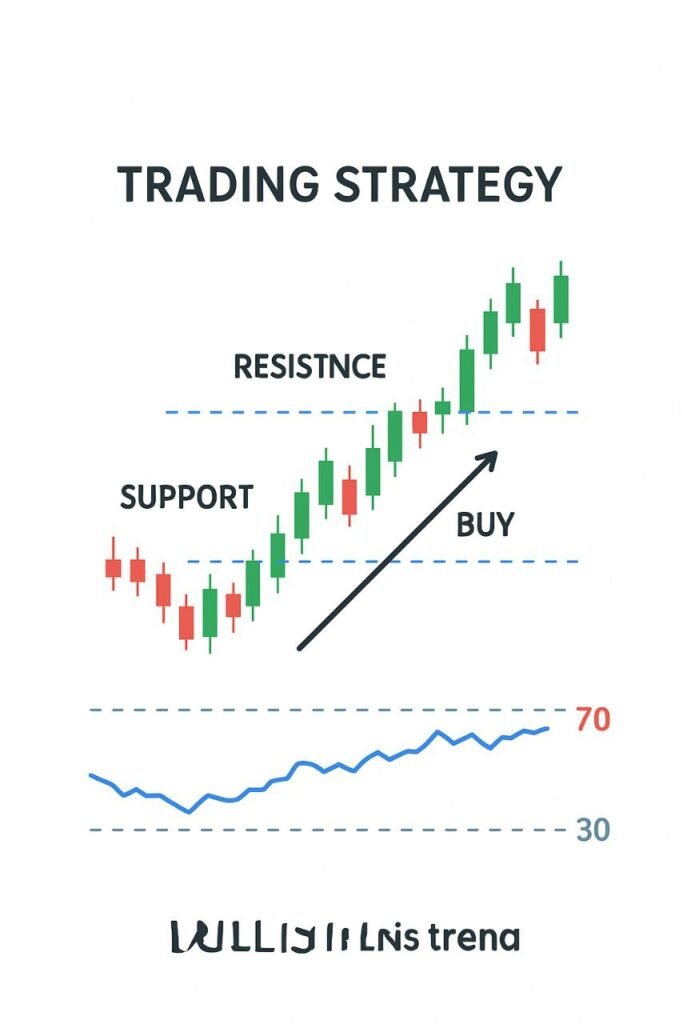
This chart shows a simple but powerful Price Action + RSI trading strategy.
The candlesticks clearly indicate that the market is moving in a steady uptrend.
🔵 Support Zone
The lower blue dotted line represents the Support level, where the price touched multiple times and bounced upward.
Support = Buyers Zone, meaning buyers entered the market and pushed the price higher each time it reached this area.
🔴 Resistance Zone
The upper blue dotted line shows the Resistance level, where the price faced difficulty breaking above.
Resistance = Sellers Zone.
🟢 Buy Entry Signal
The arrow in the chart indicates a Buy Entry.
When the price bounces from the Support level and forms higher highs and higher lows, it confirms an uptrend — making it a good buy opportunity.
📉 RSI Indicator (30–70 Levels)
The RSI line at the bottom shows:
When RSI moves above 30, it indicates buyers are gaining strength
When RSI moves near 70, it signals overbought conditions — but in a strong uptrend it can continue rising
In this strategy, a buy signal becomes stronger when the price bounces from support and RSI remains between 40–60.
JOIN EXNESS BROKER 3/7 MINUTES VERIFY ACCOUNT
WITHDRAWAL IN FEW MINUTES
Exness:
https://one.exnessonelink.com/a/j295642k3f
XM :
https://www.xm.com/referral?token=VMcR3Zp27768XbCPjr9nGA