✅ Overall Market Structure
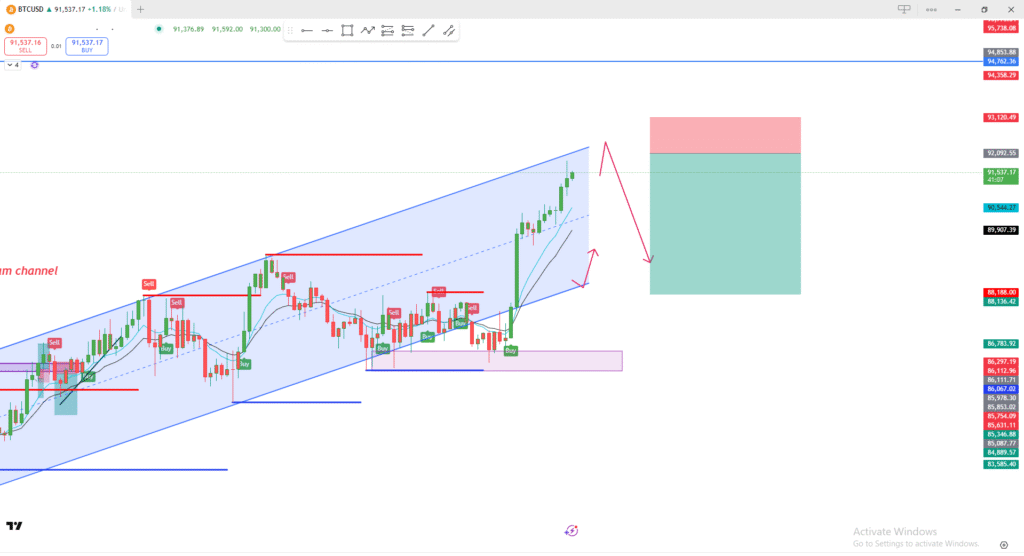
- The chart shows BTC moving inside an ascending (bullish) channel.
- Price is currently near the top of the channel, which is typically a zone of potential resistance where price may pull back.
- The lower boundary of the channel has been respected multiple times, confirming the trend.
✅ Recent Price Action
- A strong bullish push took price from the lower channel boundary straight toward the upper boundary.
- The candles near the top look extended, suggesting momentum is high but possibly overextended.
- The chart includes a projected reversal zone, indicating your expectation of a pullback.
✅ Possible Scenarios (Based on the Drawing)
1️⃣ Short-Term Rejection (Likely)
- Because price is at the upper trendline, it may:
- Reject downward,
- Retest the midline or lower boundary of the channel.
This matches the red downward arrows drawn.
2️⃣ Retracement to Support
- Your arrows show price possibly dropping to:
- The mid-channel dashed line, or
- The lower trendline (strong support).
The lower trendline is a strong buy zone if the channel remains valid.
3️⃣ Breakout Scenario (Less likely but possible)
- If the bullish momentum continues, BTC could break above the channel.
- But the large red area (resistance zone) suggests you expect price to struggle there.
✅ Indicators Used
Although the indicators are not fully visible, I can see:
- Moving Averages (MA ribbon) — showing upward slope → bullish trend.
- Buy/Sell signals (probably from an algo indicator) marking repeated reactions near levels.
✅ Risk/Reward Box
- The green box = target area for a long setup.
- The red box = stop-loss zone.
- This suggests you are planning a short-term correction, then another upward move.
🎯 Summary
- BTC is currently at a resistance zone near the top of an ascending channel.
- A pullback is likely, as shown in your arrows.
- Key support levels are:
- Mid-channel
- Lower channel line
- Trend remains bullish as long as BTC stays inside the channel.