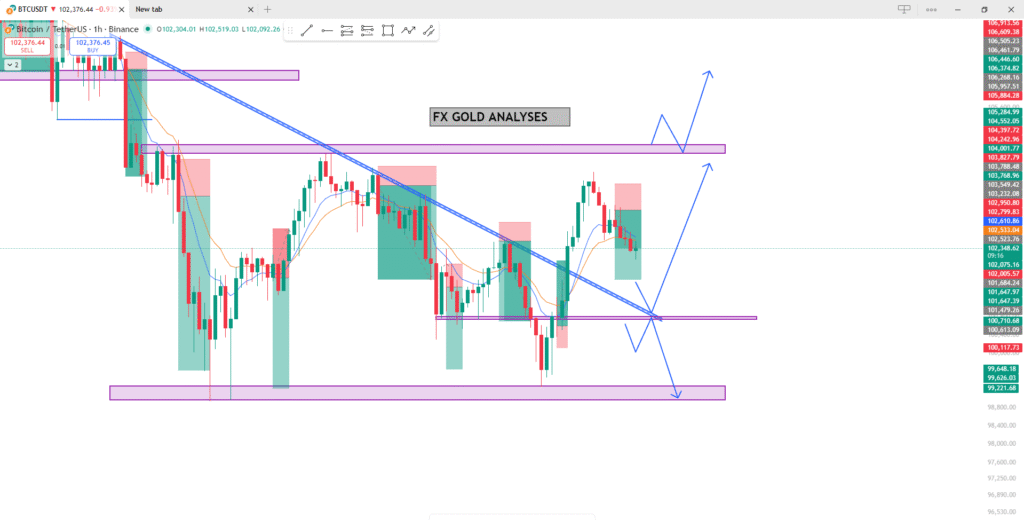
🔍 Overall Structure
- The chart shows BTC/USDT (1-hour timeframe on Binance) currently trading around $102,300.
- There was a descending trendline (blue) that has now been broken — a potential bullish signal.
- Price is currently pulling back (retesting) the breakout area.
📈 Bullish Scenario (Upside Potential)
If price bounces from the purple support zone around $101,800 – $102,000:
- It would confirm a successful trendline retest.
- The next resistance (target) zones are around:
- $103,500 – $104,000
- Then $105,800 – $106,000
🟢 Bullish Confirmation Signs:
- Strong bullish candle forms at the $102,000 area.
- Moving averages (orange/blue lines) start crossing upward again.
📉 Bearish Scenario (Downside Risk)
If price breaks below $102,000:
- It could trigger a bearish continuation.
- The next strong support zone is around $99,600 – $99,800.
🔴 Bearish Confirmation Signs:
- 1H candle closes below $101,800 with strong selling volume.
- Momentum indicators point downward.
⚙️ Summary
| Scenario | Condition | Target Levels |
|---|---|---|
| 🟢 Bullish | Bounce from $102k zone | $103.5k → $105.8k |
| 🔴 Bearish | Break below $101.8k | $99.8k → $99.6k |

JOIN EXNESS BROKER 3/7 MINUTES VERIFY ACCOUNT
WITHDRAWAL IN FEW MINUTES
Exness:
https://one.exnessonelink.com/a/j295642k3f
XM :
https://www.xm.com/referral?token=VMcR3Zp27768XbCPjr9nGA