Technical Analysis of the Chart
1. Overall Structure
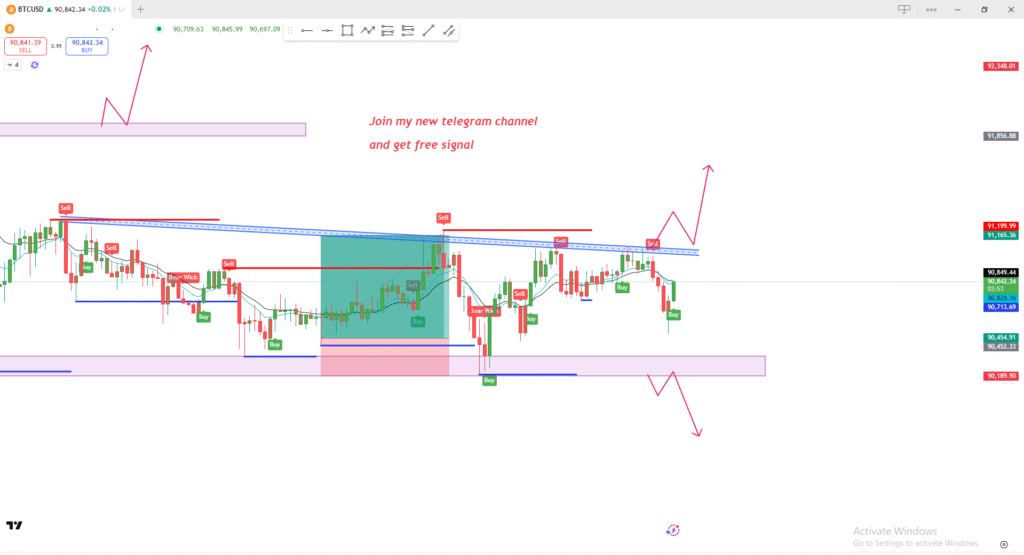
- This is a BTC/USD intraday chart with several marked zones:
- Upper resistance zone around 91,150 – 91,200
- Lower demand/support zone around 90,450 – 90,190
- A descending trendline (blue) connects multiple highs, showing earlier bearish pressure.
2. Key Observations
A. Resistance Zone
- Price has repeatedly reacted around the 91,150 – 91,200 zone.
- Several Sell labels are placed at this zone, showing that sellers were active here.
- The chart shows a potential breakout scenario if price breaks above this trendline and re-tests it successfully.
B. Support Zone
- The purple support block at the bottom shows where price reversed upward multiple times.
- The “Buy” labels near this area indicate bullish reaction from this demand zone.
C. Trendline Behavior
- The blue descending trendline was tested several times.
- Recently, price seems to be pressing against the trendline, suggesting weakening bearish momentum.
3. Possible Scenarios (as drawn on the chart)
Bullish Scenario
- Price breaks above the blue trendline and the red resistance line.
- Then pulls back to retest the breakout area.
- If the retest holds, price may move higher toward the next resistance zone.
Bearish Scenario
- Price fails to break the trendline.
- It falls back into the large purple support block.
- If that zone breaks, a deeper drop toward lower levels is suggested.
4. Price Action Structure
- The market is currently ranging between:
- Upper resistance: ~91,150–91,200
- Lower support: ~90,450–90,190
- Multiple small “Buy” and “Sell” labels show short-term scalping entries.
5. Summary
The chart shows:
- A range market with clear support and resistance.
- Market is currently near trendline resistance.
- A breakout could lead to bullish continuation.
- A rejection could bring price back to the support block.