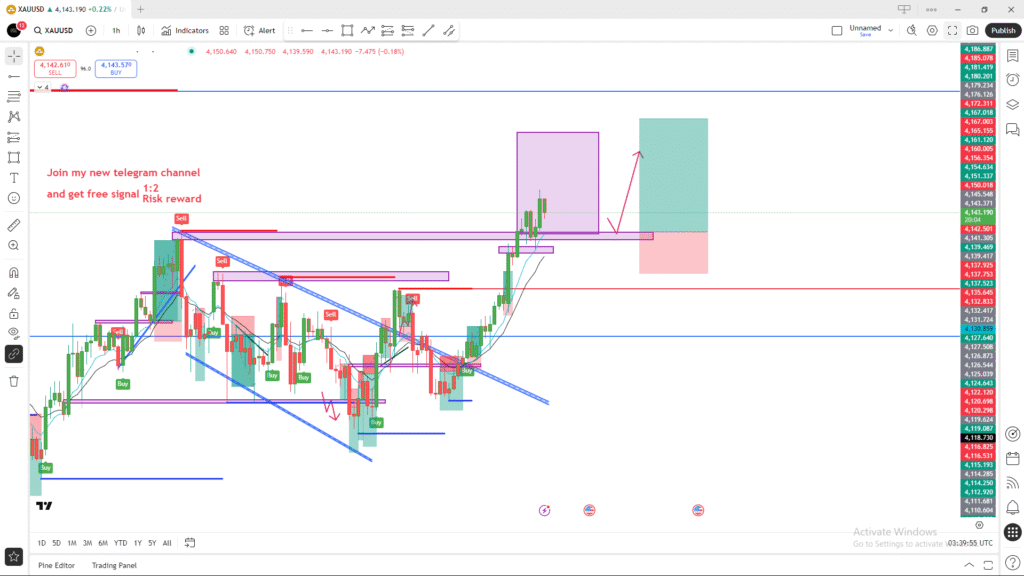
📊 Chart Analysis (XAUUSD – 1H)
1. Market Structure
- The overall trend in the visible area is bullish.
- Price has recently broken above a resistance zone (marked in purple).
- After the breakout, price is now pulling back toward the same zone, which may act as new support (R → S flip).
2. Key Levels
Support Zone (Pullback Area)
- The purple horizontal area just below the current price is the expected retest zone.
- If price stays above this zone, buyers remain in control.
Resistance Zone / Target Area
- The big green box at the top marks the take-profit zone.
- This represents the projected bullish continuation.
3. Expected Price Action
According to the red arrow drawn on the chart:
- Price may retest the support zone (purple box).
- If a bullish reaction appears (rejection wick, bullish engulfing, etc.),
- The market may continue pushing upward toward the green target zone.
4. Trade Setup Shown
Entry
- Expected around the support retest area.
Stop-Loss
- SL marked inside the red box below the support.
- This protects the trade if price breaks down.
Take-Profit
- TP marked inside the green box.
- Risk-to-reward ratio indicated as 1:2.
5. Summary
- The chart suggests a bullish trend continuation setup.
- Price is expected to retest previous resistance → turn into support.
- A long (buy) entry is planned after confirmation.
- SL below support, TP at the next resistance swings.